TTAI
FCF International Quality ETF (TTAI)

High conviction exposure to high-quality international companies

Potential for excess returns over the S&P Developed Ex-U.S. BMI NTR Index, with similar volatility

A diversified portfolio where ESG factors are important inputs
|
Nav |
Nav Change |
||
|---|---|---|---|
|
Market Price |
|
Market Price Change |
|
| NAME | Quarter | 1 Yr | 3 Yr | 5 Yr | Annualized Since Inception |
| NAME TTAI Market Price | Quarter 2.77% | 1 Yr 13.24% | 3 Yr 1.33% | 5 Yr 7.08% | Annualized Since Inception 5.35% |
| NAME TTAI NAV | Quarter 2.74% | 1 Yr 12.78% | 3 Yr 1.24% | 5 Yr 7.14% | Annualized Since Inception 5.29% |
| NAME MSCI All Country World Index ex USA | Quarter 4.69% | 1 Yr 13.26% | 3 Yr 1.94% | 5 Yr 5.97% | Annualized Since Inception 5.15% |
Expense Ratio: 0.59%. The performance data quoted represents past performance. Past performance does not guarantee future results. The investment return and principal value of an investment will fluctuate so that an investor's shares, when sold or redeemed, may be worth more or less than their original cost and current performance may be lower or higher than the performance quoted. Performance current to the most recent month-end can be obtained by calling (toll free 800-617-0004). Short term performance, in particular, is not a good indication of the fund's future performance, and an investment should not be made based solely on returns.
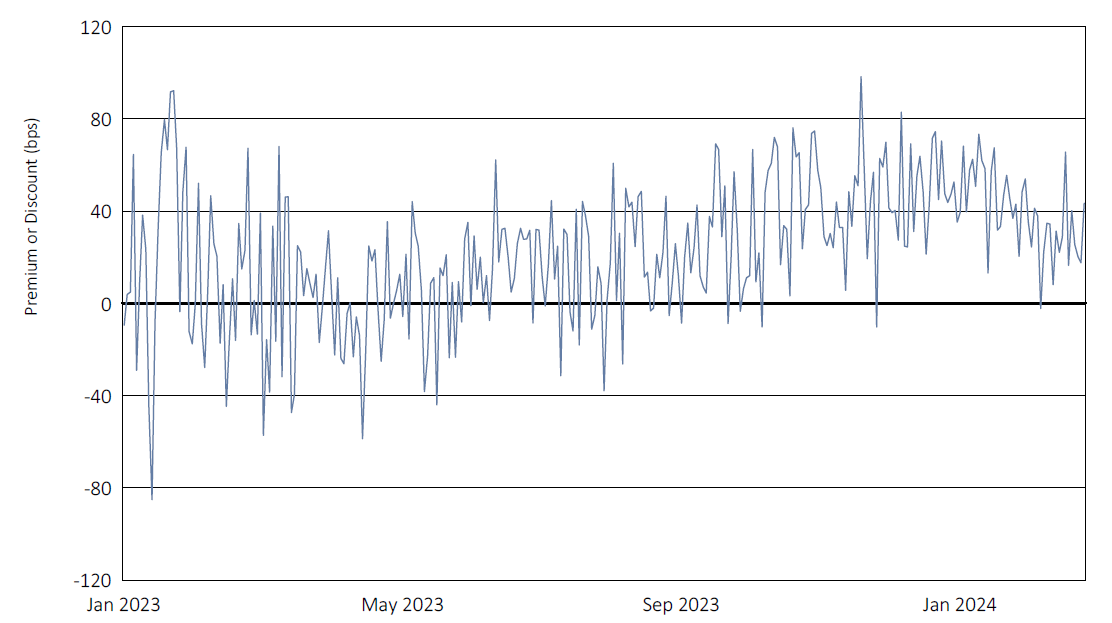
| Calendar Year 2023 | Calendar Year 2024 through March 31, 2024 | |
| Days Traded at premium | 183 | 60 |
| Days Traded at net asset value | 0 | 0 |
| Days Traded at discount | 67 | 1 |
This table and line graph are provided to show the frequency at which the closing price of the Fund was at a premium (above) or discount (below) to the Fund’s daily net asset value (“NAV”). The table and line graph represent past performance and cannot be used to predict future results. Shareholders may pay more than NAV when buying Fund shares and receive less than NAV when those shares are sold because shares are bought and sold at current market prices.
| EX-DATE | RECORD DATE | PAYABLE DATE | AMOUNT |
| EX-DATE 12/28/2017 | RECORD DATE 12/29/2017 | PAYABLE DATE 01/02/2018 | AMOUNT $0.07160616 |
| EX-DATE 12/28/2018 | RECORD DATE 12/31/2018 | PAYABLE DATE 01/02/2019 | AMOUNT $0.20479334 |
| EX-DATE 12/30/2019 | RECORD DATE 12/31/2019 | PAYABLE DATE 01/02/2020 | AMOUNT $0.51465475 |
| EX-DATE 12/30/2020 | RECORD DATE 12/31/2020 | PAYABLE DATE 01/04/2020 | AMOUNT $0.20292472 |
| EX-DATE 12/30/2021 | RECORD DATE 12/31/2021 | PAYABLE DATE 01/03/2022 | AMOUNT $0.73352044 |
| EX-DATE 12/28/2022 | RECORD DATE 12/29/2022 | PAYABLE DATE 12/30/2022 | AMOUNT $2.36816586 |
| EX-DATE 3/3/2023 | RECORD DATE 3/6/2023 | PAYABLE DATE 3/7/2023 | AMOUNT $0.01093063 |
| EX-DATE 6/5/2023 | RECORD DATE 6/6/2023 | PAYABLE DATE 6/7/2023 | AMOUNT $0.38259734 |
| EX-DATE 9/6/2023 | RECORD DATE 9/7/2023 | PAYABLE DATE 9/8/2023 | AMOUNT $0.16440858 |
| EX-DATE 12/14/2023 | RECORD DATE 12/15/2023 | PAYABLE DATE 12/18/2023 | AMOUNT $0.11850113 |
| EX-DATE 12/27/2023 | RECORD DATE 12/28/2023 | PAYABLE DATE 12/29/2023 | AMOUNT $0.01893163 |
| EX-DATE 3/5/2024 | RECORD DATE 3/6/2024 | PAYABLE DATE 3/7/2024 | AMOUNT $0.02891920 |

Introducing the first edition of our FCF Spotlights and Rankings report. Our clients are always asking, “where has the free cash flow gone recently?” In this monthly report, we will highlight free cash flow profitability sector leaders and laggers, sector climbers and sliders and spotlight two names that have recently entered and exited the portfolio. We look forward to your feedback!
Join our community of cash flow enthusiasts
Thank you for submitting the form.